

Onboarding vs. Implementation: Do You Need Both?
- 9 Min read
Your company’s success or failure could hinge on its customer experience (CX). According to Gartner’s data, 81% of marketers consider customer experience the most efficient means for keeping ahead of the competition.
Most CX leaders face an immense challenge when designing customer experience programs with tangible outcomes. You don’t have to be on that list—instead, get to know your target market and how they interact.
Customer experience (CX), which refers to all client interactions with your organization, is one of the strongest indicators of whether or not customers will return or recommend you in future interactions.
This guide provides instructions on how to measure customer experience metrics and enhance KPIs used by customer experience professionals to monitor customer loyalty and satisfaction. This will clarify whether business or product changes have had positive effects.
Customer experience metrics (or CX metrics) aim to capture how satisfied and fulfilled customers feel throughout their experience with your service.
CSAT is one of the easiest ways to measure customer experience.
While typically used for customer service, customer satisfaction score can also indicate CX since support interactions make up a large part of CX. The survey measures how satisfied your clients are after an encounter with your company.
After a client has contacted a support team via an online chat service, they may rate the representative’s response based on the solution’s satisfaction or usefulness. After a customer purchases a service or product, you could ask them how they feel about it.
Asking customers to rate their satisfaction at an appropriate point in the customer journey (for example, on a sales confirmation page or during the logout process) can be an excellent way to measure CSAT. Add up all the 4- and 5-star ratings. Divide by the total number of responses. Then multiply this by 100.
The Net Promoter Score (NPS) is a simple measurement that shows what percentage of people would recommend an organization to others. Also, NPS measures customer loyalty to the organization (how likely they are to recommend you to a friend or colleague).
Net promoter score can be collected by companies sending out one-question surveys asking customers “How likely would you be to recommend us to a friend?” The customer rates their likelihood on a scale from 0-10.
Net Promoter Score (NPS) is one of the most important customer experience metrics for measuring customer satisfaction because it measures customers’ attitudes toward your brand.
The feedback and score you receive will help to guide your next steps. When measuring customer experience, you can ask passives and detractors how to improve your performance and offer limited-time offers, special group memberships or exclusive deals to engage the promoters further. Promoters can help your business by encouraging potential clients to leave reviews and attracting them.
Customer experience can be improved by resolving complaints and pleasing your most loyal customers.
Your customers want easy interactions. It should be simple to navigate your website. It should be simple to use and assemble your products. It should be simple for clients to contact your customer service team.
Measuring customer experience with a Customer Effort Score (CES) survey is perfect since you let customers rate interaction with a business or its products or services as neutral, easy or difficult. Clients must measure how much effort they must exert to reach their goals.
Divide the total survey responses by your sum of customer effort ratings to calculate Customer Effort Score (CES).
You want to find ways to improve the customer experience of a product that customers rated difficult. If your menu is hard to locate on your site, you will need to redesign it or use a simpler template to improve CX.
You should monitor your Customer Effort Score closely. Take action on any negative comments and make improvements to all services that are not scoring well. Since CES measures touchpoints, you will quickly identify the major friction points.
The referral rate customer experience measurement counts the number of customers who refer your business to friends and colleagues. NPS measures how many customers say they would recommend your company, while referral rate indicates how many actually do. The referral rate is a customer experience metric that represents the percentage of purchases by those referred by other customers; for this to happen, customers must first have experienced positive interactions throughout their work with your company—from signing up and receiving invoices through to initial sign-up and ongoing service provision.
They’re more likely to refer you as your processing progresses more easily.
Let’s see how to calculate the customer Referral Rate. These CX metrics are defined as the ratio of sales generated through referrals divided by total purchase value. One out of every hundred clients gained through referrals is considered a 1% referral rate.
Retention rate and customer churn rate CX metrics represent opposite ends of the spectrum. Churn rate metrics can show how many customers leave your firm within an agreed-upon timeframe. Maintaining strong client retention/brand loyalty metrics is an invaluable way to measure business performance.
Customer churn rate measures the rate at which people stop subscribing or purchasing from a service or product provider. In contrast, retention refers to an organization’s capacity to keep its existing customers. Every business strives for increased client retention over turnover since acquiring new customers costs significantly more. Companies can track customer churn rate to see which customer segments are most likely to leave over time and why. Survey those canceling subscriptions or returns and see why they left.
Calculating churn rate can be done by dividing the total client losses during a specific timeframe with their original numbers. You should include only customers from when that period started as evidence for comparison purposes. You should count only customers who were with you then as references for customer churn rate calculations.
As stated above, customer retention rate measures customer loyalty by measuring how many customers an organization retains during any given timeframe.
Calculating customer retention rate may prove more complex since you must factor in both customers that have been retained over a specific timeframe and lost/gained customers as part of this calculation.
Calculating retention rate: want to know more? The formula to count this customer experience metric varies, depending on whether it is being calculated over a week or month period.
You want to achieve a balance between retaining existing clients and attracting new customers who become loyal. If your retention rate is low, but you are getting high sales, then you should determine why clients only buy your products or services a couple of times and leave.
The Average Resolution Time is the time that it takes for a team of customer success professionals to resolve each support ticket.
The ART is also measured in hours or days, just like the FRT (first response time). Calculated by adding up all the customer interactions and then dividing that total by the number of chats/tickets.
The faster the ART is, the higher the likelihood that a client will be happy and enjoy a positive service experience.
You can calculate the Average Resolution Time by dividing the total time you spent on tickets during a specific period by the number of ticket requests.
If you use any platform for tracking customer satisfaction through tickets, this data should be easily available and accessible.
Customer Lifetime Value (CLV), is defined as the expected annualized average revenue that any client will bring to your company over their lifespan.
LTV customer experience measurement stands for Lifetime Value, but customer experience experts use LTV to indicate customer happiness and retention. Satisfied customers tend to return more frequently, thus increasing your LTV in turn. A win-win scenario!
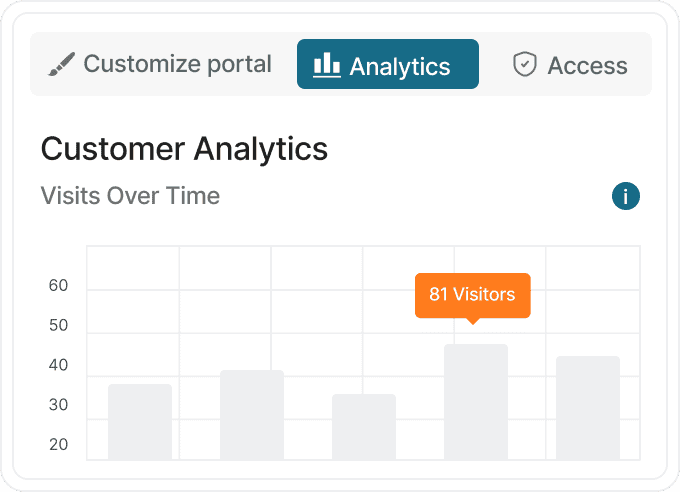
CX metrics like MAU are used to track user engagement over time. Looking back over how many active users were present within any month can reveal any changes in behavior over time.
Customers access your software on an ongoing basis; therefore, you must calculate either their Daily Active Users (DAUs) or Weekly Active Users (WAUs), depending on how frequently they visit it.
However, people may only spend brief amounts of time using specific components. Users might abandon features within seconds after being introduced to them.
Possible outcomes could include choosing an inappropriate section, finding it unnecessary or being overwhelmed with complexity. Any such issues must be promptly resolved to ensure the continued development of their project. Customers will benefit from removing unused components of the product and making it easier to use.
The First Contact Resolution (FCR), which is a measure of customer service effectiveness, also indirectly measures customer satisfaction.
This customer service measure shows the efficiency of your staff in responding to customer inquiries after your first attempt at contact.
You can calculate the rate of FCR by dividing the number of requests that were resolved on the first try by the total number.
You must first define “first attempt” for your business. Your customer service management, your capacity and the contact channels that you offer will determine how many “first attempts” are made. Will you, for example, count all requests, such as abandoned calls, misdirected messages and customer service calls, or just those you actually receive? Before you begin monitoring, try to consider such specifics and situations.
Compared to other customer experience metrics, this one measures how smoothly your customers interact with your business. The higher your FCR is, the better your chances are of having a successful program for customer experience management. Act immediately if your FCR is low!
You can get a clear picture of the efficiency of your Customer Support Department by monitoring both FCR and ART.
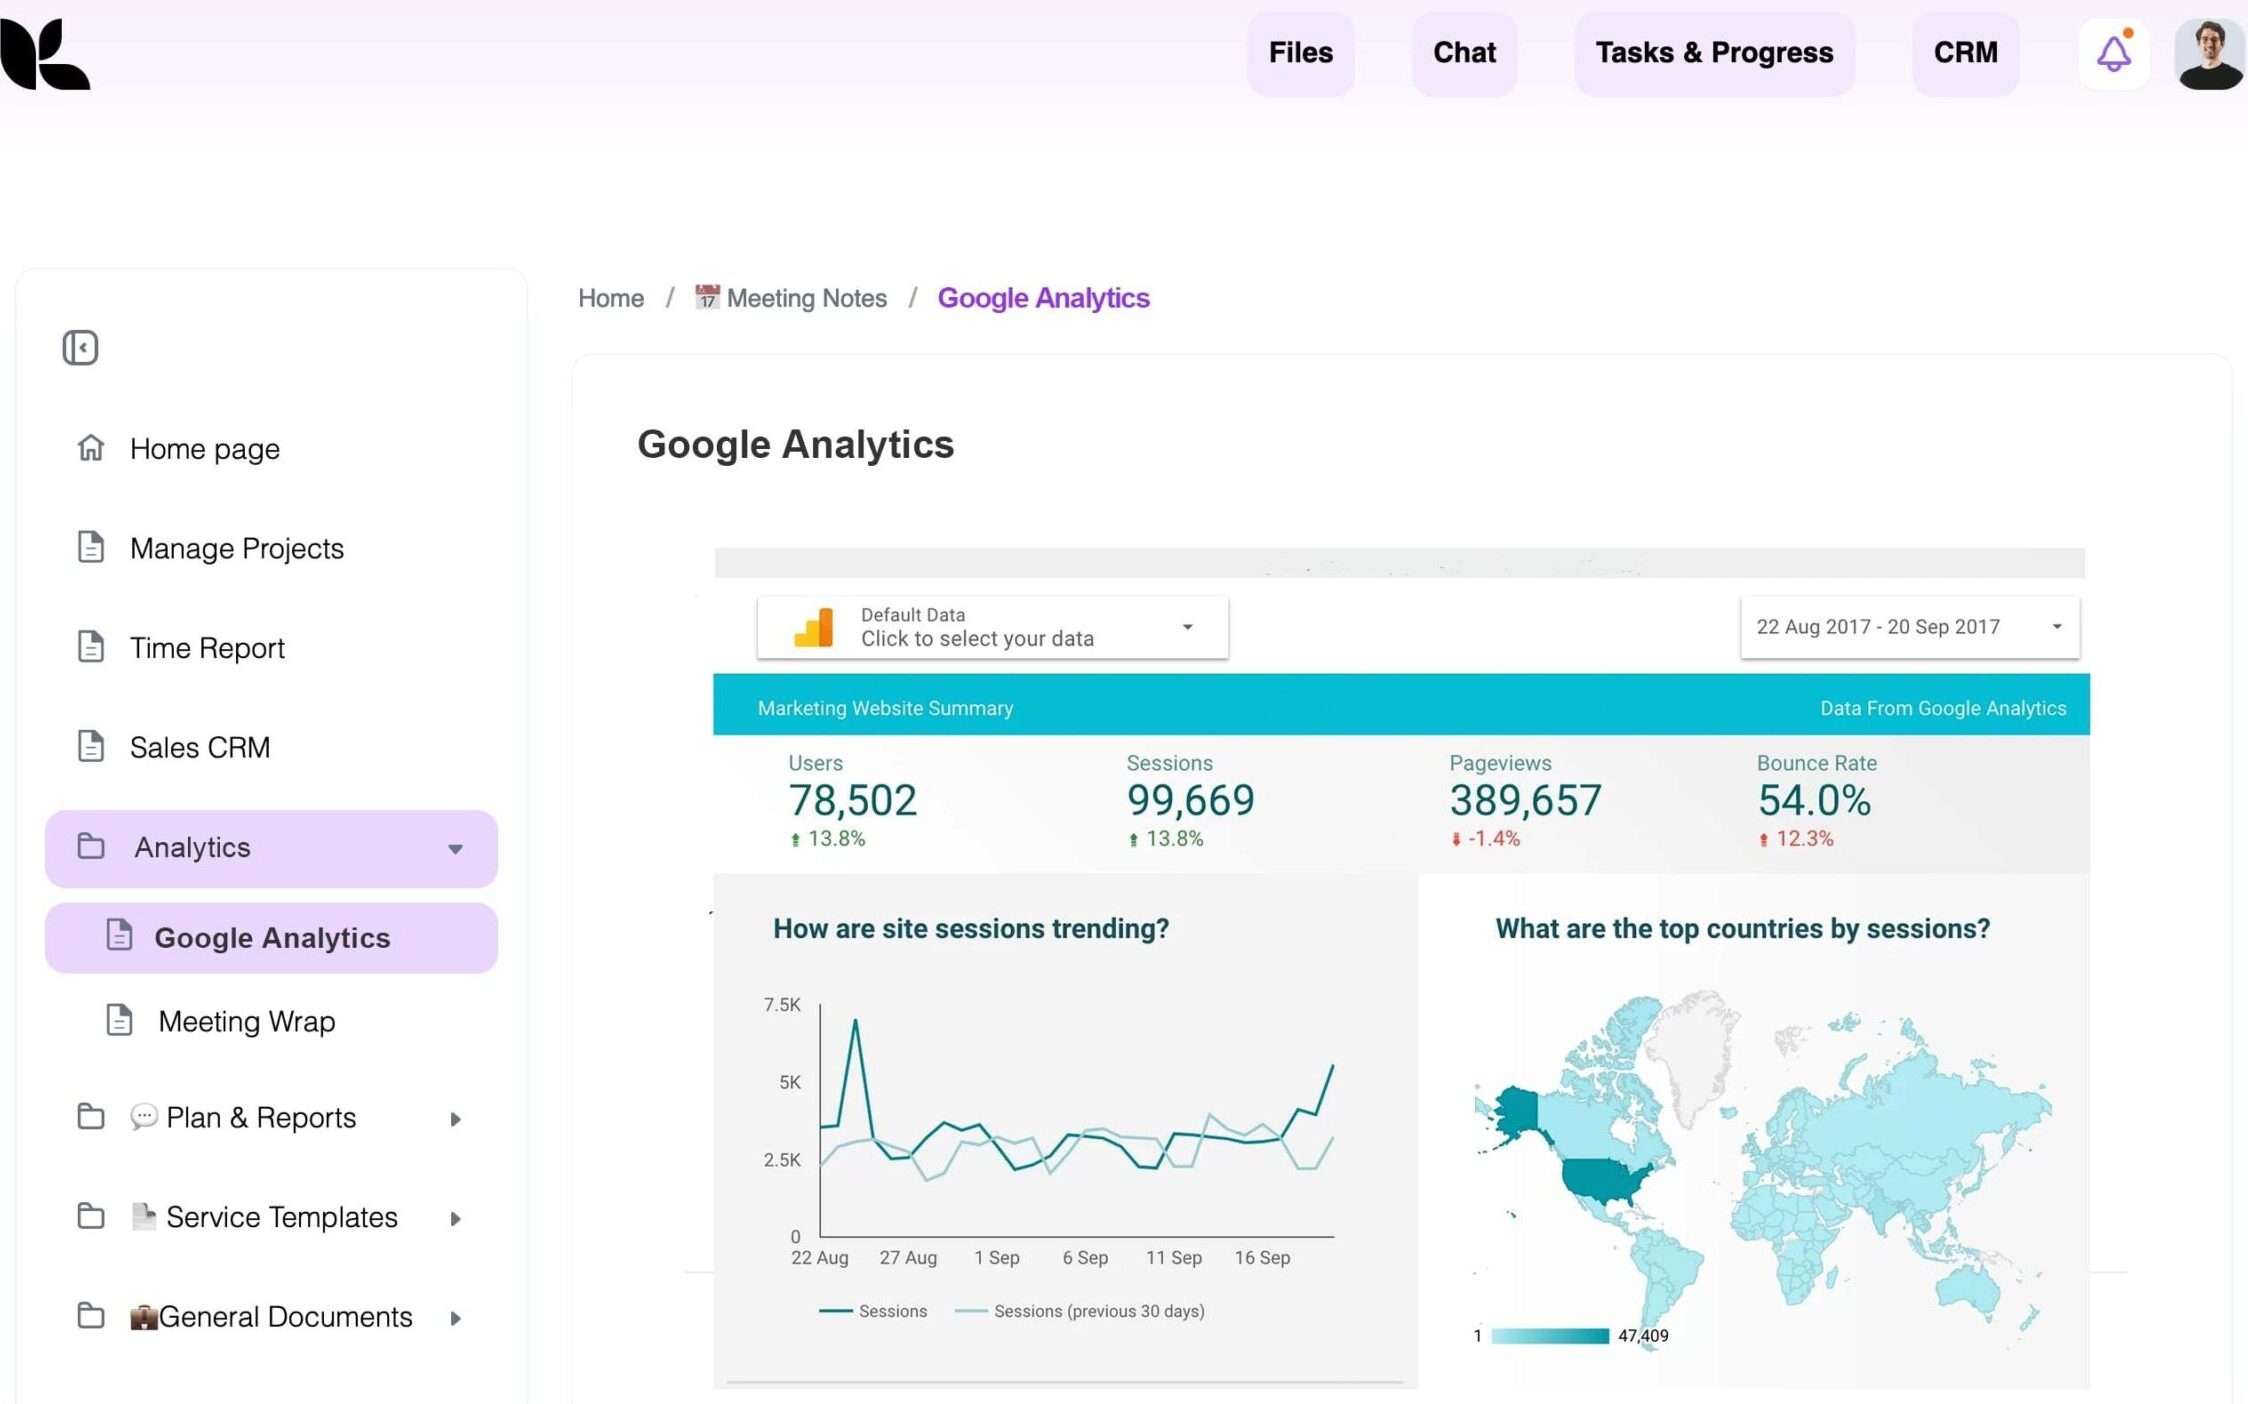
Use your analytics tools to examine the customer journey to better understand how to improve the customer experience.
You’ll want to begin measuring customer experience by gathering data about your customer journeys from social media, advertising, websites, company events and product reviews. Collect information regarding customer loyalty, email communications, surveys conducted online or feedback you received. Create a tab or page within your customer journey map that reports metrics related to each touchpoint so you can assess customers’ experiences.
An effective customer journey map will assist in answering critical customer-related inquiries about needs and motivations while simultaneously understanding every touchpoint a client encounters throughout their journey, providing an efficient means of collecting customer journey analytics.
To accurately measure customer experience, it’s essential that businesses employ customer experience metrics like trends, retention rates and surveys to assess how satisfied your customers are during each phase of their journey. You can use retention, churn and survey results data as indicators as to whether customers will return or recommend your brand.
Your company needs a compelling customer experience program in place to reliably gather customer data, measure key indicators related to customer sentiment and create actionable insights about them. FuseBase can assist your company in this regard and give actionable customer insights.
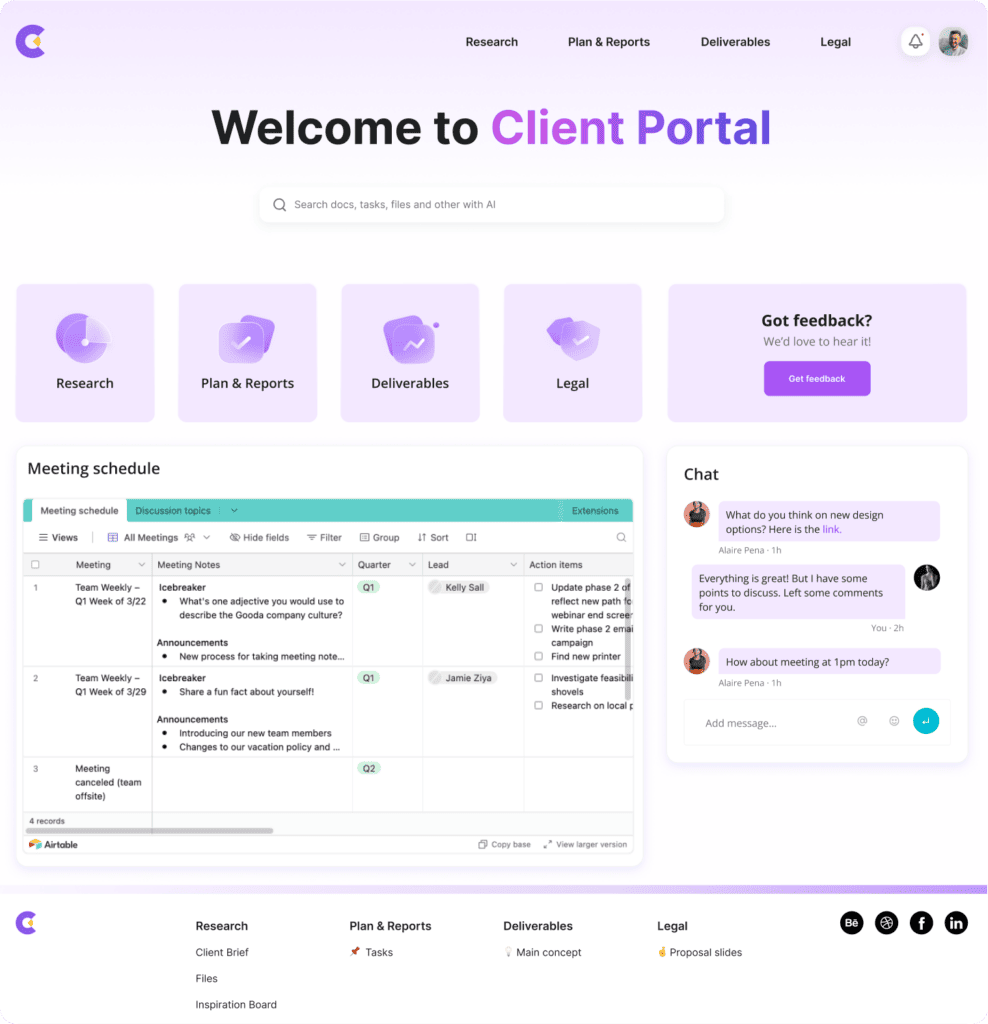
FuseBase is an innovative platform created for customer-oriented businesses to collaborate with clients while streamlining teamwork. Equipped with communication channels, content platforms and tool sets for efficient client data collection. FuseBase serves to enhance business offerings to clients while providing a seamless teamwork experience to employees.
FuseBase is equipped with a set of features to quickly respond to client feedback and create the experience they crave:
Customer experience metrics can help you create and evaluate a customer experience program, giving your organization an advantage in an increasingly crowded market. Your survey results may also serve to combine operational with business metrics for a greater understanding of your customer journey.
On average, companies track 2.5 customer experience metrics. You may be able to measure even more, but make sure the information collected serves its intended purpose—only collect numbers if necessary!
Consider these three things when selecting the best customer experience metrics:
Beginners should start by figuring out two basic concepts: Customer Churn Rate and Customer Lifetime Value. This will allow you to determine how satisfied your customers are.
The survey fatigue effect is real. Measuring customer experience is not an easy task. It’s not enough to bombard your audience with survey questions.
Decide which metrics are essential for your company and put them in order of importance. And then, meet your clients on the channels they like and when it’s convenient for them.
If your customer just spoke to your sales team through live chat, you can show them the CSAT survey within the chatbox. The customer is more likely to give their feedback while they are still thinking about the problem.
Don’t lose track of metrics. Set new goals and objectives based on your customer’s feedback. Analyze your customer journey and survey results using dedicated tools. It will allow you to quickly draw conclusions.
Use expert-recommended tools to keep your customers happy
Your company must dedicate sufficient resources and invest time and energy tracking customer experience metrics.
These metrics will not only allow you to gain a clearer picture of customer experiences with your product or service. Still, it will also give actionable insight on ways to enhance them further. They could prove immensely valuable for your business by decreasing churn rates and raising trial-to-customer scores.
Once again, this is also an invaluable way to identify which areas of your team are the most efficient and which require improvement. By learning more about customer experiences, you will be able to implement changes that make customer experience even better.
Found it useful? Share the article with your community
Get weekly tips and insights on how to grow your business