14 Top Client Collaboration Software (Tested and Reviewed in 2025)
- 10 Min read
Imagine having all your client data, Google Analytics, marketing data and critical metrics accessible in a centralized platform. Well, that’s the power of client dashboards.
For a client-facing business, dashboards are a modern (and often underrated) way to go above and beyond and visually provide transparent reporting data to clients. A business with good rapport with its clients receives more insightful feedback and has an easier time communicating and adapting marketing strategies based on informed client reports.
Agencies, resellers and customers require a centralized hub for all campaign- and client-related data and workflow management. And to give complete transparency while requiring little teamwork, dashboards must be dynamic and have live charts that are automatically updated.
A client dashboard is a management and reporting tool with the potential to streamline campaigns, provide information and facilitate quicker turnarounds.
This article will explore the benefits of a client dashboard and how it can improve communication between teams and clients, ultimately enhancing client reporting.

Client dashboards, in their most basic form, are user-friendly project management tools with everything we need for client reporting and give customers direct access to and control over real-time data and historical data. You can use dashboards to view data, saving you and your clients from constantly checking in with each other for recent updates and providing seamless client access.
A customer dashboard provides a snapshot of the company’s day-to-day operations. Your company can monitor business-critical KPIs like sales, conversion rates, landing page performance, Google Analytics and even social media activity. At the beginning of campaigns, you may leverage a client dashboard to gather information worth analyzing later for a comprehensive client report.
Client dashboard software can pull data from various channels within one platform! It’s an excellent method for keeping tabs on the development of specific processes and providing data stories to involved parties. Besides the fact that it can enhance relationships with clients, it is also perfect for ensuring you haven’t overlooked any relevant details or underutilized their valuable resources.
A dashboard is a visual representation of data that allows you to track key performance indicators. The data is shown in several visual and numerical formats. You can show it in a graph if there is too much information to fit in a table.
Most dashboards support different kinds of charts, like pie charts, bar charts and line graphs. When you need to show a lot of information in a small space, these charts are your best bet.
Also, there can be several types of filters on a dashboard. The filters let you examine the historical data in a particular way, like by event type or time period. The report may also provide details on the dashboard’s creator.
For those wondering whether client dashboards are really helpful for a company’s website analytics, we have an answer – Yes, they are! And there are several reasons. Here are just a few of the many real advantages client dashboards have:
Now you understand that clients’ dashboards provide real-time access to critical data from multiple sources, including platforms like Google Search Console, and present it in an aesthetically pleasing and user-friendly format. They offer a valuable tool for businesses to stay informed and make the best decisions, as well as generate comprehensive client reports on a regular basis.
In case you already have some experience in creating a client dashboard, here’s what we wanna know: was it easy? If it was not, you should definitely switch to a different client dashboard software. Most tools make visualizing easier for users. Here are the steps you need to take to set up your client dashboard.
Knowing what information will be shared and who you will share it with is the first step in developing a client dashboard.
In case you’re working in a group where everyone has access to the same data sources, make sure everyone can quickly grasp its significance and contribute to it effectively.
You might have to approach a dashboard design differently if you are creating a dashboard for a single user who does not require the same data as the team.
Also, the dashboard must be intuitive to use. When showing numerous data sources, try to minimize repetition and give viewers any extra context they might require.
Your dashboard’s layout should facilitate sharing data with your client base.
Your client dashboard design must have clear navigation, legibility, readability and aesthetic appeal. Best client dashboards are beautiful, functional and have a white label option to show off to clients and ensure customer satisfaction. That’s what makes it easy for you to change the dashboard, and easy for the client to get information about the project whenever needed.
Identify customers’ goals first when developing a dashboard for them in the context of digital marketing. Identify the specific digital marketing metrics that align with their goals and make them visible by putting them at the front and the center of the dashboard.
Don’t forget to make sure every customer has access to specific metrics on their dashboard.
Remember that creating a standardized dashboard for all your customers is an excellent way to connect with them and reduce miscommunication. As you work on some campaigns, the customer will have a clearer idea of where things stand.
By creating a standardized interface, your customers will always know where they stand without bothering you for answers.
Users may track their product usage with the help of a dashboard you provide. Social network feeds, user activity and site navigation are all examples of what may be found here. A good client dashboard is uncomplicated, aesthetically pleasing, straightforward and has all the features you might need. As mobile users account for 84% of all internet visitors, your site must be mobile-friendly.
A well-executed design will make the most of space to showcase an informative and helpful profile with the largest display size.
These guidelines will help you make client dashboards that your clients, coworkers and boss will love (and actually use).
A beautiful client dashboard is only useful with the correct key performance indicators (KPIs) for digital marketing; knowing what important information to include from various data sources is crucial.
The purpose of a dashboard is not solely to do an in-depth analysis of data; instead, it is also to provide quick insight for those who need to know how things are progressing and what actions they can take to improve them. This includes generating informative client reports that highlight the key findings and recommendations based on the dashboard data, all conveniently accessible on a single screen.
So, how many metrics should a client dashboard have? There is no “ideal” quantity. But ten is a decent jumping-off point.
Information devoid of context is meaningless. Never, ever drop a figure without explaining it first. For example, is it acceptable to have a typical click-through rate of 10%? Who can say? A fantastic outcome for one business might be disastrous for another. Better start reporting by providing some detailed information to help your audience make sense of the data displayed on your client dashboard is a good strategy. Like, when compared to the same time last year, what was the data rate?
Understanding the bigger picture is crucial in answering the “why” question about these figures.
The main point of client dashboards is to create visual representations of data to aid communication. After all, dashboards provide a graphical interface for displaying data. After you’ve settled on the metrics that will make up your client dashboard, you must ensure they are understandable.
Here’re some examples of client dashboards and how to customize them.

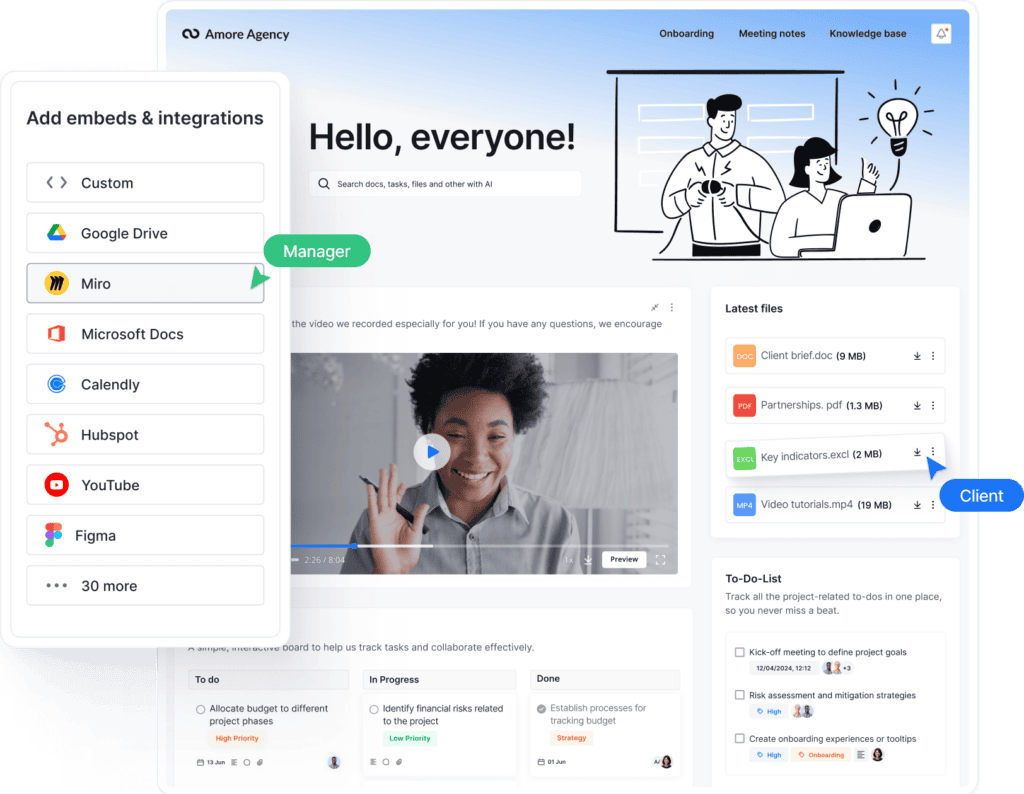
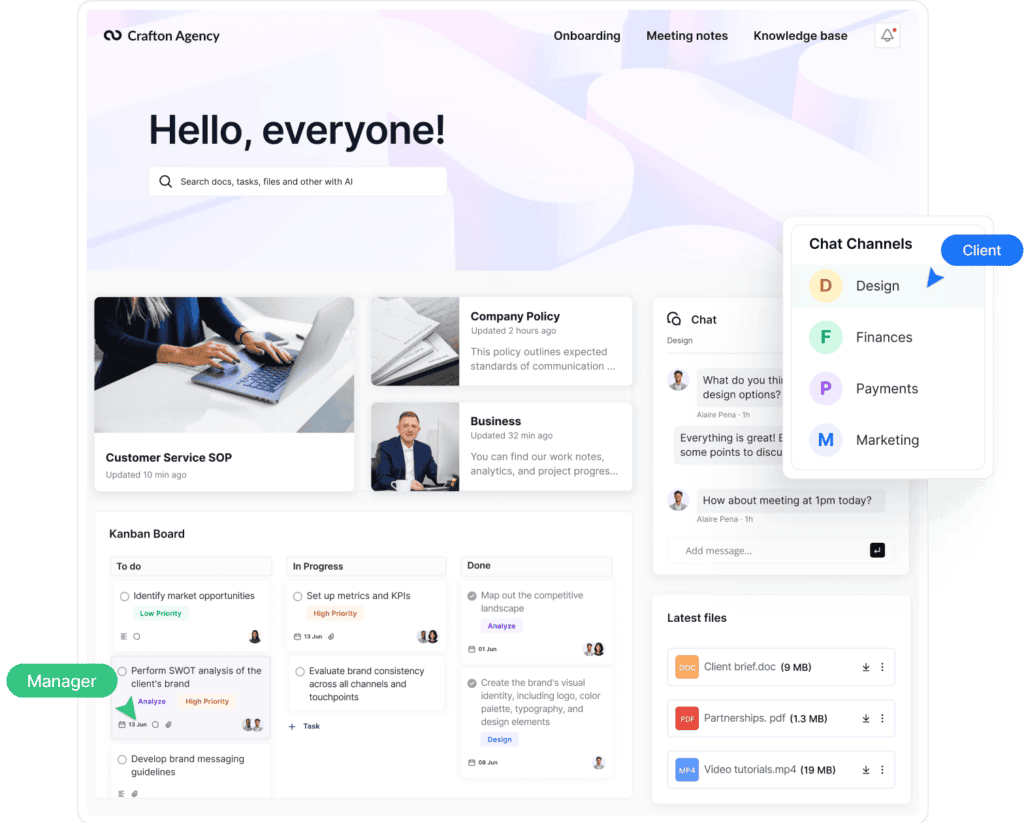
FuseBase lets you create and customize a list of completed projects with your clients, streamlining the reporting process.
For example, you can save a template in your workspace and edit it so that it fits all your needs. You do not need to create a dashboard from scratch, as you can use a FuseBase template and adjust it for yourself. There you can specify your completed tasks and back them up with pictures, photos and embeds to prove your competence. Also, you can include the results of your work and any suggestions you have for making the process even more efficient.
Report using guidelines:

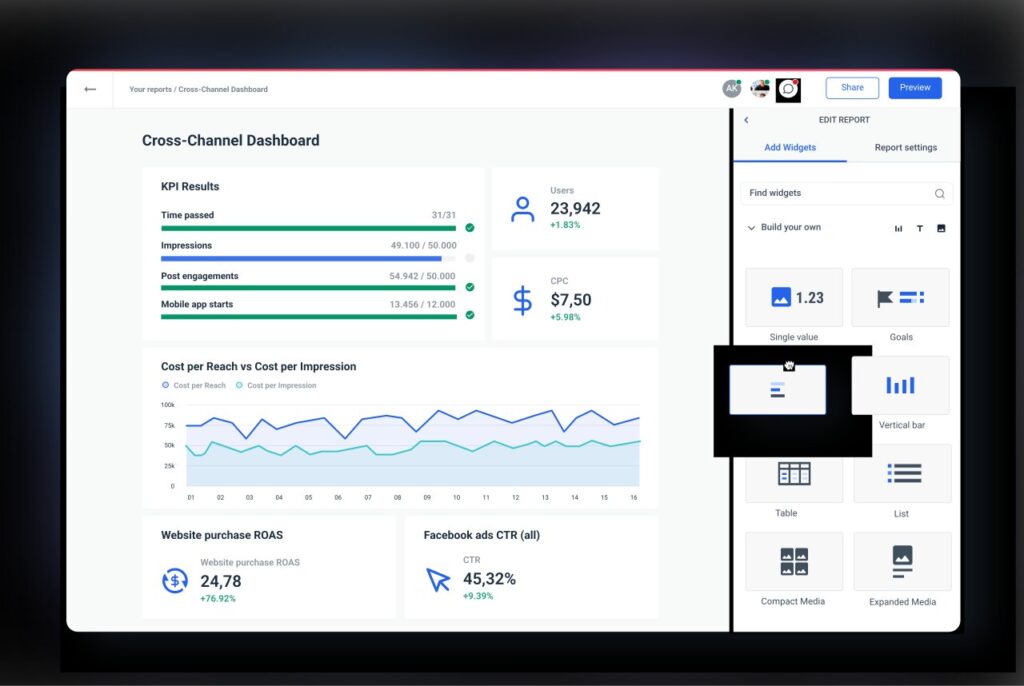
Custom reports from Whatagraph, a powerful analytics tool, will give you an excellent overview of your business and actionable insights to help you move forward.

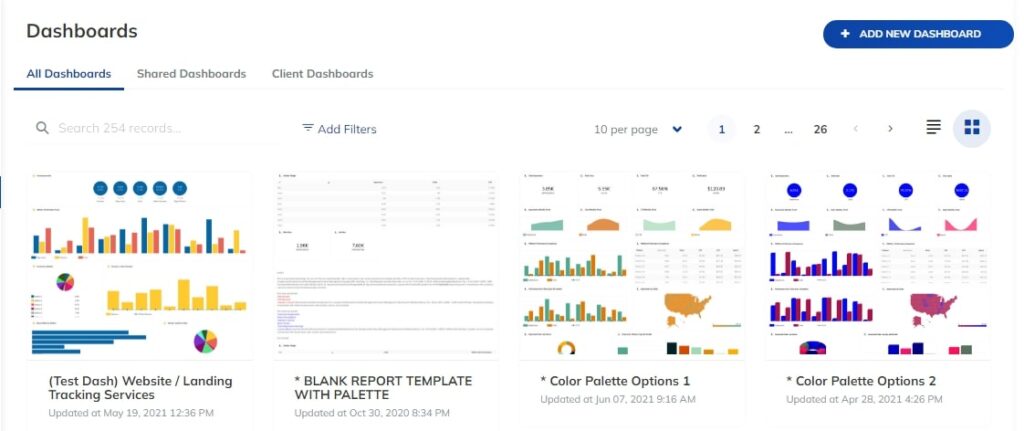
TapClicks is another example of the agencies that let you create client dashboards, connect with clients, make custom reports, manage permissions and access your marketing data across different teams, departments, clients and more.
A client dashboard is great for connecting with your clients, providing a quick overview of important information and showing the progress you’ve made on their projects. Furthermore, it enables you to create all kinds of reports, for example, a custom report or some professional reports that present a comprehensive analysis of the project’s performance, insights and recommendations.
Keeping a spreadsheet of your work might be a pain, but a client dashboard makes it easy to see your data progress.
After reading this article, we hope you better understand what a client dashboard is and how to create one.
Discover the power of Fusease client dashboards with our experts!
Check out the FuseBase Facebook page to get the latest news and updates!
Disclaimer
Parties other than FuseBase may provide products, services, recommendations, or views on FuseBase site (“Third Party Materials”). FuseBase is not responsible for examining or evaluating such Third Party Materials, and does not provide any warranties relating to the Third Party Materials. Links to such Third Party Materials are for your convenience and do not constitute an endorsement of such Third Party Materials.
Found it useful? Share the article with your community
Get weekly tips and insights on how to grow your business