Nimbus Note tables are not just tables! You can use them to make initial calculations — manage your income and expenses, filter by date, check the amount of completed checkboxes.
The calculation panel will simplify the work with data in cells. For example, for number and currency columns you can see the total amount from all cells or the average value, and for a column of type Date, you can quickly find the earliest or latest date.
The counting panel is displayed below the last row.
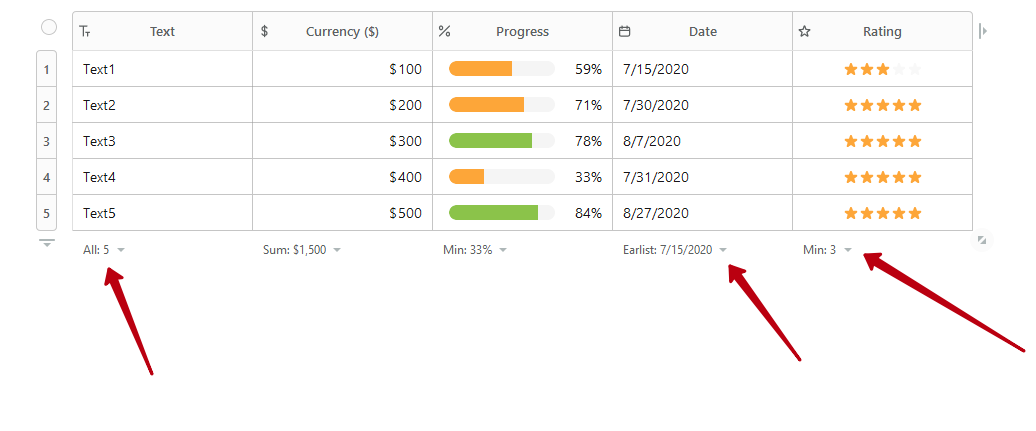
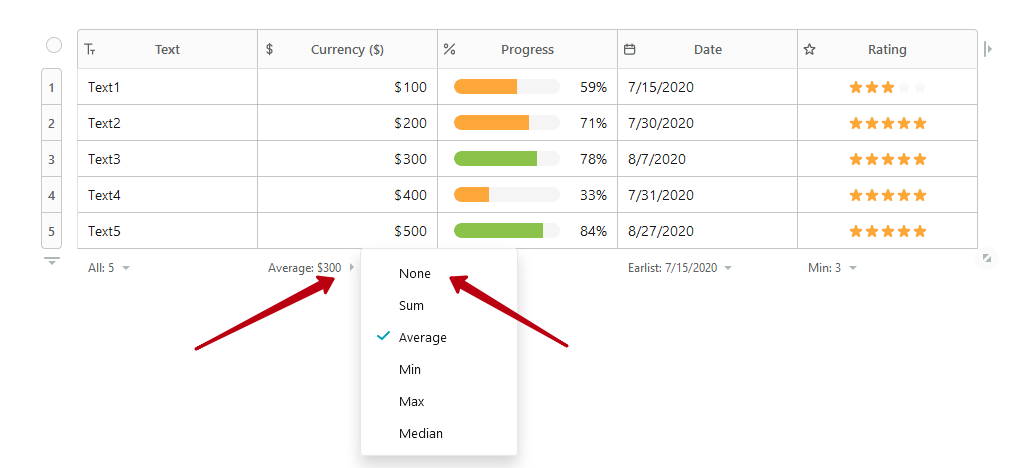
If you need to change Count Type, you can click on the current type and select the desired value.
The type of calculation depends on the type of column. Let’s look at this in more detail.
Columns and counting types #
Multi Type / Text Columns #
All – total number of cells in the column
Empty – the number of cells without data entry
Filled – the number of cells where there is at least some data
Unique – cells where there are unique values, i.e. which are not repeated with others. Empty cells are not included here.
Percent empty – empty cells as a percentage of the total. For example, if there are 4 cells in total and 2 of them are empty, then it means 50%
Percent filled – the number of cells where there is at least some data. Shown as a percentage.
Percent unique – cells where there are unique values, i.e. which are not repeated with others. Empty cells are not included here. Shown as a percentage.
Numbers / Currency #
Sum – the sum of numbers from all cells in the column.
Average value – we add up the values and divide by the number of cells. For example, if three columns indicate $10, then the average will be $10.
Min value – the smallest value is shown. For instance, there are cells with numbers 5 and 10. The min value is 5.
Max value – the largest value is shown. For example, there are cells with numbers 5 and 10. The max value is 10.
Median – the median value.
Date #
Earlist date – Earliest date – this displays the earliest date in cells.
Latest date – latest date in cells.
Date range (days) – we look at the earliest date in the column and the latest, and then subtract from them to calculate the number of days. For example, August 12, 2020 to August 17, 2020 is 5 days.
Date range (months) – the same, but in months. For example, a date in one column is August 12, 2020, and another is September 25, 2020. This would be 1 month..
Checkboxes #
All – total number of cells.
Checked – the number of checkboxes that are marked as completed.
Unchecked – the number of checkboxes that are not yet marked.
Percent checked – the number of checkboxes that are marked as completed. Shown as a percentage.
Percent unchecked – the number of checkboxes that are not yet marked. Shown as a percentage.
Rating #
Minimum – the minimum rating that was selected in the column cells.
Maximum – the maximum rating that was selected in the column cells.
Average -the average value of ratings. For example, if there are cells with a value of 1 3 5, then the average is 3.
With rating – a menu opens with a choice of the number of stars and the number of lines with the desired rating displayed.
Progress column #
Min – the minimum value of progress in the cells of the column.
Max – the maximum value of progress in the cells of the column.
Average – the average value of progress in the cells of the column. For example, there are cells with a value of 10, 30, 50, and accordingly, the average value will be 30.
With progress – a menu opens with a choice of progress. For example, you can indicate progress greater than 50% and accordingly the number of lines with the desired progress.
Colloborate #
All – total number of cells in the column.
Empty cells – the number of cells without data entry.
Filled cells – the number of cells where there is at least some data.
Unique cells – cells where there are unique values, i.e. which are not repeated in others. Empty cells are not included here.
Percent empty – empty cells as a percentage of the total. For example, if there are 4 cells in total and 2 of them are empty, then 50% is shown.
Percent filled – the number of cells where there is at least some data. Shown as a percentage.
Percent unique – cells where there are unique values, i.e. which are not repeated with others. Empty cells are not included here. Shown as a percentage.
Files #
All – total number of cells in the column.
Empty cells – the number of cells without data entry.
Filled cells – the number of cells where there is at least some data.
Min size – shows in megabytes the minimum file size per cell. When hovering over the size, the file name is displayed.
Max size – shows in megabytes the maximum file size per cell. When hovering over the size, the file name is displayed.
You can also add negative numbers in your tables. Just write down “-“ in the cell before your number. Watch how to do that in the video below.
Can I hide the count for individual columns? #
Yes, click on the counting menu of the desired column and select None. To enable counting, you need to point to the place where the counting menu is displayed and select the desired type of counting.